Pregnant? Text or call now: 1-800-236-7898
Are you pregnant and considering adoption?
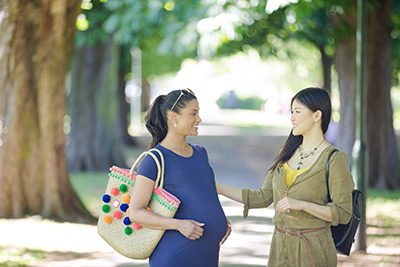
Get the free financial help and caring, emotional support you need.
Choose an adoptive family you love and the relationship you want after adoption.

How does adoption work?


What can we do to help you?
Access to hundreds of adoptive families
Medical & financial support
Lifetime support
Choose the life you want for your baby
Personal birth mother mentor
Counseling available
Have questions?
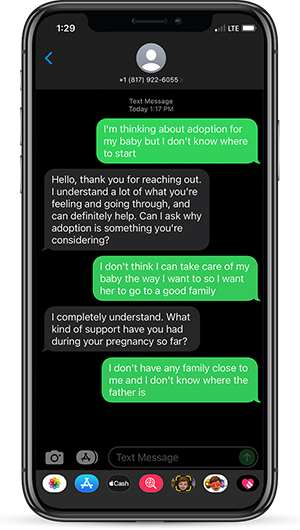
Ask us anything. Really.
Everyone arrives at adoption with different needs and in different situations. Our team is ready to help.
Text us your questions. No pressure. No cost. Completely confidential.
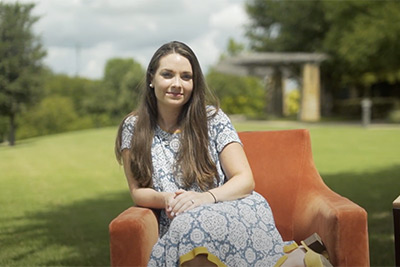
Would you like to watch stories from birth moms?
Emmas's Story

Destiny's Story

Mackenzie's Story
Stephanie's Story
Want to choose an adoptive family you love?
Statistics

adoptions have been completed

years of adoption service

children placed with adoptive families in 2019